
.
Table of Contents | ||||
|---|---|---|---|---|
|
| Infonote |
|---|
This is Part 3 of a 3-part tutorial series for the Simple Expense Summary scenario. It is recommended that you complete Part 1 - Getting Started and Part 2 - Working with Formulas before starting this section. |
| Info | ||
|---|---|---|
| ||
There is a downloadable C# project with completed templates and code. The completed example of the template is available under templates/part3_template.xlsx), page (Part3.aspx), and code behind (. The code for this part of the tutorial can be found in Part3.aspx.cs) are included in the SimpleExpenseSummary project available for download as part of the ExcelWriter Basics Tutorials. |
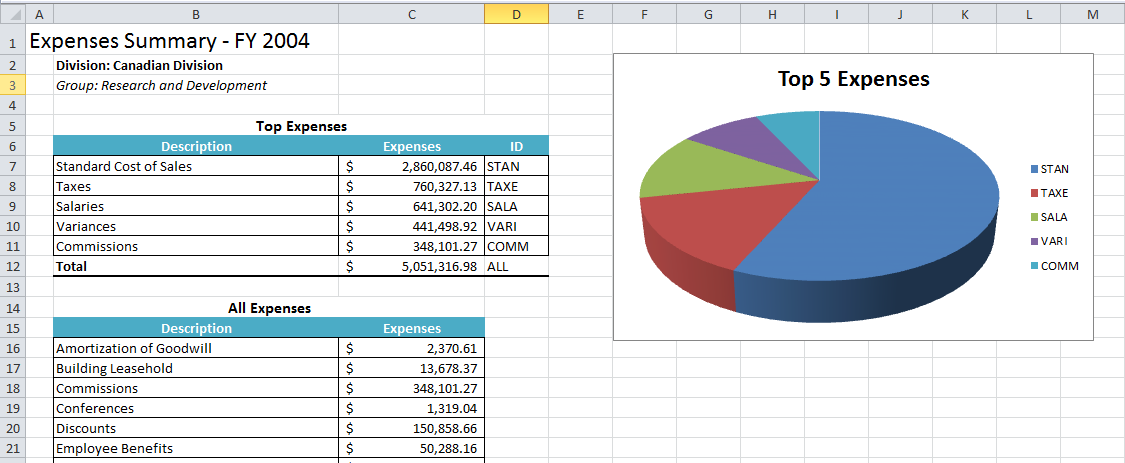
This part focuses on adding an Excel chart to the template file from Part 2. Specifically, this covers adding and formatting a pie chart in the template file. We will only be modifying the template file. There are no changes to the code from Part 2.
...
You will see that the pie chart is pulling the data from C7:C11 and the labels from D7:Dll.
| Note |
|---|
For information about writing this code, see Part 1 - Getting Started . |
| Code Block |
|---|
using SoftArtisans.OfficeWriter.ExcelWriter;
...
ExcelTemplate XLT = new ExcelTemplate();

XLT.Open(Page.MapPath("//templates//part1_template.xlsx"));

DataBindingProperties dataProps = XLT.CreateDataBindingProperties();

object[] valuesArray = { "FY 2004", "Canadian Division", "Research and Development" };
string[] columnNamesArray = { "FiscalYear", "Division", "Group" };

XLT.BindRowData(valuesArray, columnNamesArray, "Header", dataProps);

DataTable dtTop5 = GetCSVData(Page.MapPath("//data//Part1_Top5Expenses.csv"));
DataTable dtAll = GetCSVData(Page.MapPath("//data//Part1_AllExpenses.csv"));

XLT.BindData(dtTop5, "Top 5 Expenses", dataProps);
XLT.BindData(dtAll, "All Expenses", dataProps);

XLT.Process();

XLT.Save(Page.Response, "Part1_Output.xlsx", false);
|
...