
.
PowerPointWriter has the ability to evaluate a certain number of formulas on data sets that are brought into a presentation.
Formulas in a Data Marker in your template can be used to calculate average, products, sums, and other formulas based on values in the data sets being bound to the template.
To place a formula into your template presentation, insert a data marker with the following syntax:
...
| Excerpt |
|---|
The PowerPointTemplate object supports some basic formulas. Each of the formulas will perform a specific operation on the values referenced. |
The formula must follow the syntax %%=FORMULA_NAME(DataSource.ColumnName)
...
To do - create demo for PowerPointWriter
The following formulas are valid with PowerPointTemplate and will be evaluated when the data are bound to the document: AVERAGE, COUNT, COUNTA, MAX, MIN, PRODUCT, STDEV, STDEVP, SUM, VAR, and VARP. Additional information is available on the How to use Data Markers page.
The WordTemplate Formula Demo where:
PowerPointTemplate.BindData method is called. There must be a call to PowerPointTemplate.BindData to bind a data source to the template, however, you do not need to include a full data marker (%%=DataSource.ColumnName) in the template to use the formula.
PowerPointWriter supports the following data marker formulas:
AVERAGE | Calculates the average of the column values |
|---|---|
COUNT | Returns the number of values (that is, the number of rows in the data source) of the column |
COUNTA | Returns the number of non-null values of the column |
MAX | Returns the maximum value from the column |
MIN | Returns the minimum value from the column |
PRODUCT | Calculates the product of the column values |
STDEV | Returns the standard deviation of the column values, treating the values as a sample |
STDEVP | Returns the standard deviation of the column values, treating the values as a population |
SUM | Calculates the sum of the column values |
VAR | Returns the variance of the column values, treating the values as a sample |
VARP | Returns the variance of the column values, treating the values as a population |
| Example |
|---|
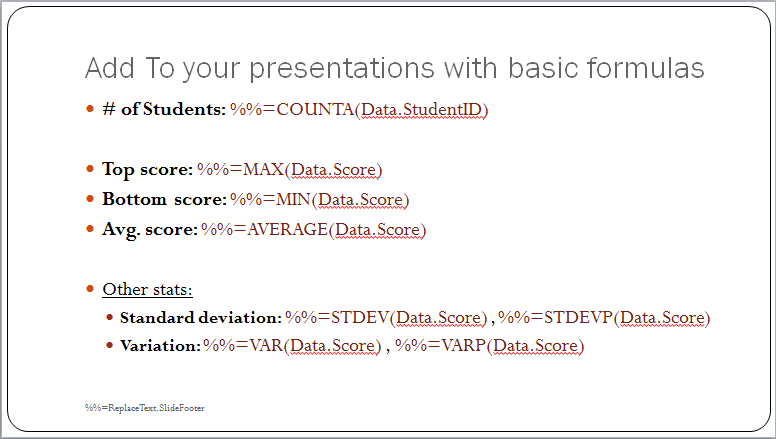
The example below uses formulas to display the average, standard deviation, maximum, and minimum college entrance exam scores of a group of fictional students as part of a table including their individual scores. A repeat block on the first row allows WordTemplate to bring in all of the values of the referenced fields.
The
The following code opens the template and binds data to it using the SetDataSource and SetRepeatBlock methods, then streans streams the resulting document to the user:
| Code Block |
|---|
protected void OnDownloadAddFormulas(object sender, EventArgs e) { WordTemplatePowerPointTemplate wtpptt = new WordTemplatePowerPointTemplate(); wtpptt.Open(Page.MapPath("templates/TestScoreReport.docx"FormulaTemplate.pptx")); string[] fields = new string[] { "TestDate", "School", "Town", "Version" }; object[] values = new object[] { new DateTime(2009, 11, 16).ToShortDateString(), //Get a Data Table of scores using the helper method DataTable ScoreData = GetScores(); //Create DataBindingProperties "Samuel Adams HS", DataBindingProperties dataBindProps "Milbury", wt.Version }; wt.SetDataSource(values, fields, ""= pptt.CreateDataBindingProperties(); DataTable//Bind dtthe =data GetScores(); wtpptt.SetRepeatBlockBindData(dtScoreData, "ItemsData", dataBindProps); wt pptt.Process(); wtpptt.Save(Response, "ScoreReport.docx", false); } private DataTable GetScores() { DataTable dt = new DataTable(); dt.Columns.Add("StudentID", typeof(string)); dt.Columns.Add("ReadingScore", typeof(int)); dt.Columns.Add("WritingScore", typeof(int)); dt.Columns.Add("MathScore", typeof(int)); dt.Columns.Add("TotalScoreScore", typeof(int)); Random rand = new Random(); int rScore, wScore, mScore; for (int i = 0; i < 30; ++i) { rScore = rand.Next(400, 800); wScore = rand.Next(400, 800); mScore = rand.Next(400, 800); dt.Rows.Add( string.Format("S{0:000000}", rand.NextDouble() * 1000000), rScore, wScore, mScore, rScore + wScore + mScore ); } DataTable dtSorted = dt.Clone(); foreach (DataRow row in dt.Select("", "StudentID asc")) dtSorted.ImportRow(row); return dtSorted; } |
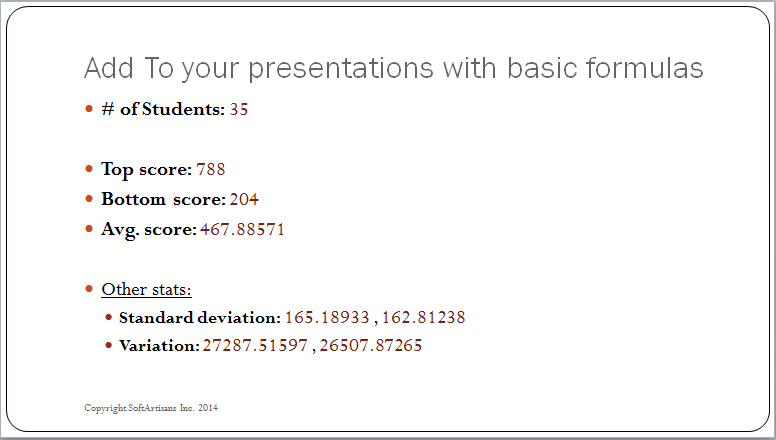
The formulas are evaluated by WordTemplatePowerPointTemplate, as you can see in the sample output fileslide:
| Example |
|---|