
.
| Excerpt |
|---|
The PowerPointTemplate object supports some basic formulas. Each of the formulas will perform a specific operation on the values referenced. |
The formula must follow the syntax %%=FORMULA_NAME(DataSource.ColumnName) where:
PowerPointTemplate.BindData method is called. There must be a call to PowerPointTemplate.BindData to bind a data source to the template, however, you do not need to include a full data marker (%%=DataSource.ColumnName) in the template to use the formula.
PowerPointWriter supports the following data marker formulas:
AVERAGE | Calculates the average of the column values |
|---|---|
COUNT | Returns the number of values (that is, the number of rows in the data source) of the column |
COUNTA | Returns the number of non-null values of the column |
MAX | Returns the maximum value from the column |
MIN | Returns the minimum value from the column |
PRODUCT | Calculates the product of the column values |
STDEV | Returns the standard deviation of the column values, treating the values as a sample |
STDEVP | Returns the standard deviation of the column values, treating the values as a population |
SUM | Calculates the sum of the column values |
VAR | Returns the variance of the column values, treating the values as a sample |
VARP | Returns the variance of the column values, treating the values as a population |
| Example |
|---|
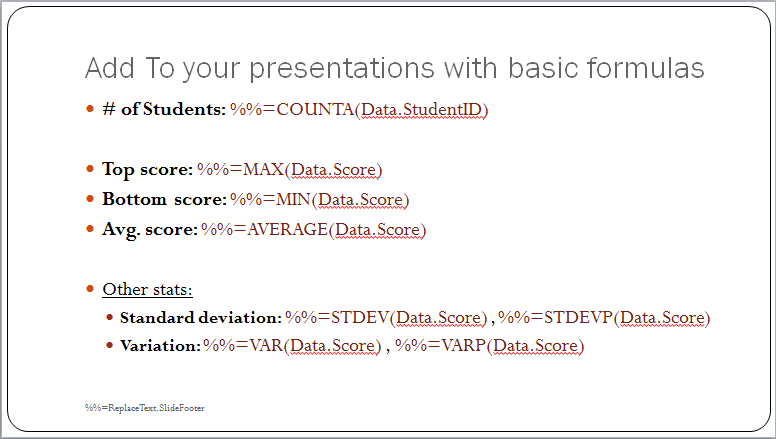
The example below uses formulas to display the average, standard deviation, maximum, and minimum college entrance exam scores of a group of fictional students as part of a table including their individual scores.
The following code opens the template and binds data to it using the SetDataSource and SetRepeatBlock methods, then streams the resulting document to the user:
| Code Block |
|---|
protected void AddFormulas(object sender, EventArgs e)
{
     PowerPointTemplate pptt = new PowerPointTemplate();
     pptt.Open("FormulaTemplate.pptx");

     //Get a Data Table of scores using the helper method
     DataTable ScoreData = GetScores();

     //Create DataBindingProperties
     DataBindingProperties dataBindProps = pptt.CreateDataBindingProperties();

     //Bind the data
     pptt.BindData(ScoreData, "Data", dataBindProps);

     pptt.Process();
     pptt.Save(Response, "ScoreReport.docx", false);
}

private DataTable GetScores()
{
     DataTable dt = new DataTable();

     dt.Columns.Add("StudentID", typeof(string));
     dt.Columns.Add("ReadingScore", typeof(int));
     dt.Columns.Add("WritingScore", typeof(int));
     dt.Columns.Add("MathScore", typeof(int));
     dt.Columns.Add("Score", typeof(int));

     Random rand = new Random();

     int rScore, wScore, mScore;
     for (int i = 0; i < 30; ++i)
     {
          rScore = rand.Next(400, 800);
          wScore = rand.Next(400, 800);
          mScore = rand.Next(400, 800);
          dt.Rows.Add(
               string.Format("S{0:000000}", rand.NextDouble() * 1000000),
               rScore, wScore, mScore, rScore + wScore + mScore
               );
     }

     DataTable dtSorted = dt.Clone();
     foreach (DataRow row in dt.Select("", "StudentID asc"))
          dtSorted.ImportRow(row);

     return dtSorted;
}
|
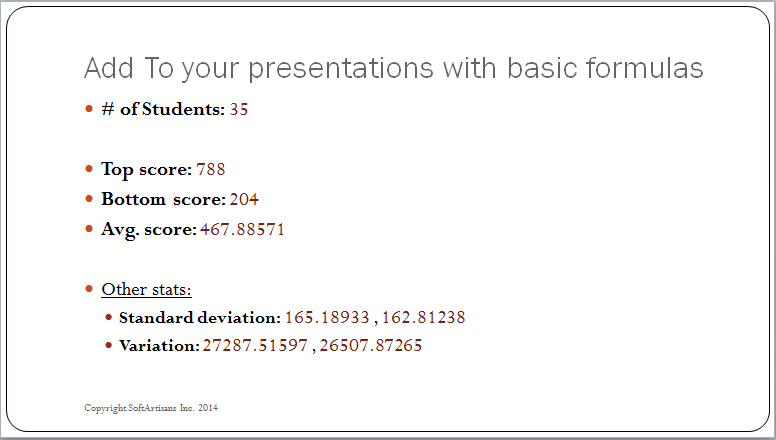
The formulas are evaluated by PowerPointTemplate, as you can see in the sample output slide:
| Example |
|---|