...
The following formulas are valid with PowerPointTemplate and will be evaluated when the data are bound to the document: AVERAGE, COUNT, COUNTA, MAX, MIN, PRODUCT, STDEV, STDEVP, SUM, VAR, and VARP. Additional information is available on the How to use Data Markers page.
| Example |
|---|
The example below uses formulas to display the average, standard deviation, maximum, and minimum college entrance exam scores of a group of fictional students as part of a table including their individual scores. 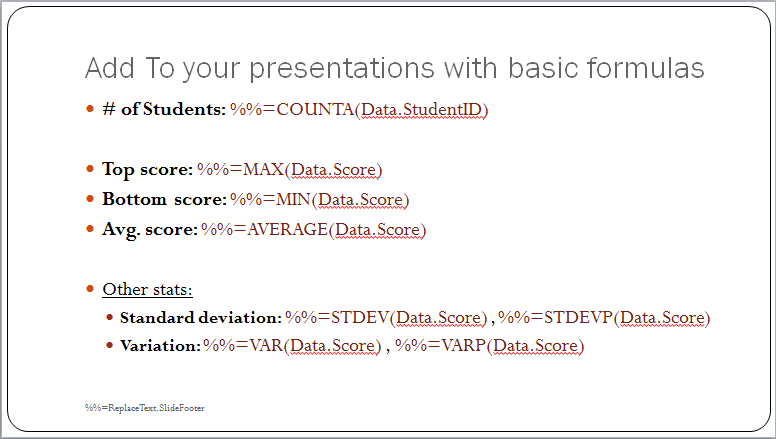 Image Modified Image Modified
The following code opens the template and binds data to it using the SetDataSource and SetRepeatBlock methods, then streams the resulting document to the user: | Code Block |
|---|
protected void AddFormulas(object sender, EventArgs e)
{
     PowerPointTemplate pptt = new PowerPointTemplate();
     pptt.Open("FormulaTemplate.pptx");

     //Get a Data Table of scores using the helper method
     DataTable ScoreData = GetScores();

     //Create DataBindingProperties
     DataBindingProperties dataBindProps = pptt.CreateDataBindingProperties();

     //Bind the data
     pptt.BindData(ScoreData, "Data", dataBindProps);

     pptt.Process();
     pptt.Save(Response, "ScoreReport.docx", false);
}

private DataTable GetScores()
{
     DataTable dt = new DataTable();

     dt.Columns.Add("StudentID", typeof(string));
     dt.Columns.Add("ReadingScore", typeof(int));
     dt.Columns.Add("WritingScore", typeof(int));
     dt.Columns.Add("MathScore", typeof(int));
     dt.Columns.Add("Score", typeof(int));

     Random rand = new Random();

     int rScore, wScore, mScore;
     for (int i = 0; i < 30; ++i)
     {
          rScore = rand.Next(400, 800);
          wScore = rand.Next(400, 800);
          mScore = rand.Next(400, 800);
          dt.Rows.Add(
               string.Format("S{0:000000}", rand.NextDouble() * 1000000),
               rScore, wScore, mScore, rScore + wScore + mScore
               );
     }

     DataTable dtSorted = dt.Clone();
     foreach (DataRow row in dt.Select("", "StudentID asc"))
          dtSorted.ImportRow(row);

     return dtSorted;
}
|
The formulas are evaluated by PowerPointTemplate, as you can see in the sample output slide: 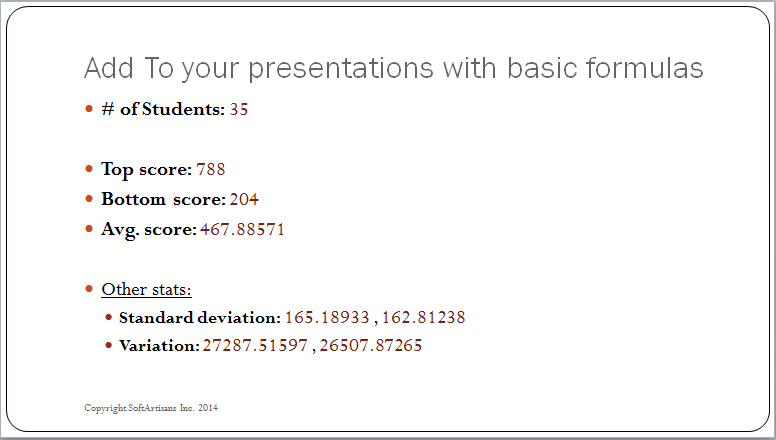 Image Modified Image Modified
|
