...
- Add a new content slide with the title 'Team Members'. This slide will contain data from the 'Team' data source about the proposed team members for the new project.
\
In Part 1, our data source only contained a single row of data. However, the 'Team' data source contains multiple rows of data that we wish to import into the presentation. In order for multiple rows of data to be imported using a data marker, the data marker must be placed in a list entry or table row. The list or table will expand dynamically to hold all of the imported rows.
For more information see Importing Multiple Rows of Data
#
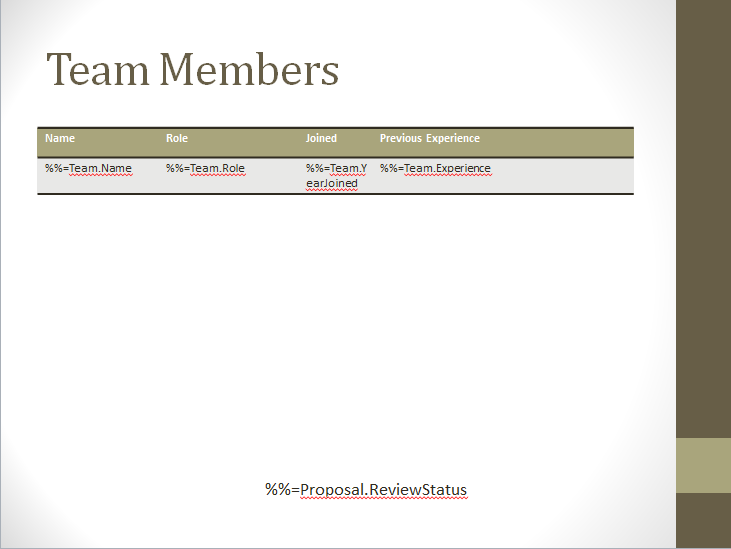
- On the 'Team Members' slide, add a new table with 2 rows and 4 columns by going to Insert > Table and choosing the appropriate size. The table will automatically be formatted based on the theme of your presentation.
#
- In the first row of the table, add the headers 'Name', 'Role', 'Joined', and 'Previous Experience'.
- # In the second row, add the following data markers under their corresponding headers:
- %%=Team.Name
- %%=Team.Role
- %%=Team.YearJoined
- %%=Team.Experience
#
- To finish this slide, add the data marker %%=Proposal.ReviewStatus somewhere at the bottom of the slide. Your completed slide should look like the following:
Fitting Data on to Multiple Slides
...
- Create a new slide and give it the title 'Expected Costs'.
#
- Add %%=Proposal.ReviewStatus to the bottom of the slide.
- # Add a table to this new slide with 2 rows and 3 columns. This table will contain data from the 'Cost' data source.
#
- In the first row of the table, label the table columns 'Type', 'Item', and 'Amount'.
#
- In the second row, add the following data markers under their corresponding headers:
- %%=Cost.Type
- %%=Cost.Item
- %%=Cost.Amt.
...
The 'Cost' data source contains more data than can fit on to a single slide. In order to ensure that data does not fall off of a slide, the Data Binding Property MaxRowsPerSlide can be set. When importing data, PowerPointWriter will stop importing data onto a slide when it reaches the MaxRowsPerSlide limit.
...
Additionally, we want to be sure that all the data from the 'Cost' data source is imported into our presentation. To do this the RepeatSlide marker can be used in conjunction with the MaxRowsPerSlide property.
When placed as the first item in the notes section of the slide, the RepeatSlide marker will copy that slide in place and continue importing data on to the new slide. This behavior will continue until the end of the data source or the MaxRowsToImport limit is reached.
For more information see Fitting Data on to Multiple Slides.
6. To use the RepeatSlide marker, add the text '%%RepeatSlide' as the first string of text in the notes section of the 'Expected Costs' slide. Make sure there is a space between %%RepeatSlide and the next item of text. The completed slide should look like the one below. Note the RepeatSlide marker in the notes section of the slide.
...
