Add a new title slide to the presentation and give it the title 'Overview'. This slide is not going to to contain any data markers, just text. The 'Overview' slide in our template file is shown below. !Slide3Final.png! Image Added #
Add a new content slide with the title 'Company History'
Add the company logo to the bottom right corner of this slide by creating a text box and inserting the data marker *%%=Company.Logo(image(2)). \ In the body of this slide we are going to insert a list outlining the history of the company. #
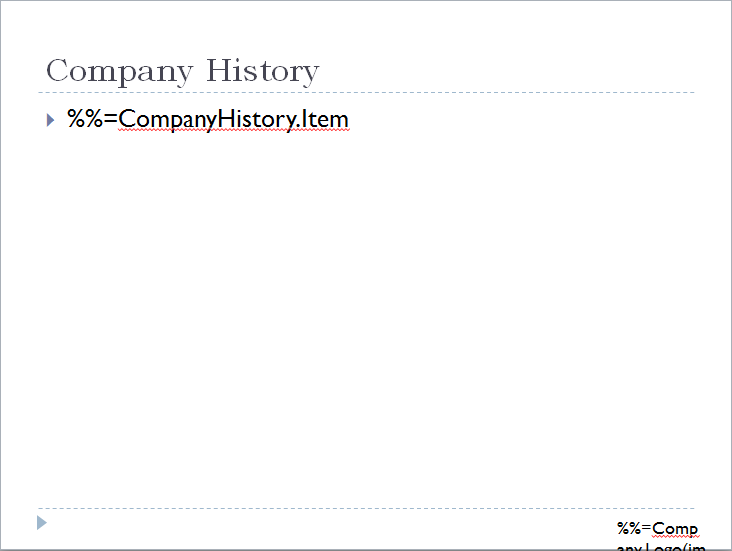
Create a new list. Add the data marker %%=CompanyHistory.Item as the first list item. !Slide4Final.png! Image Added \ Our company has a long history - too long to fit all the list items on a single slide. In order to keep the list from spilling off the slide, we can use PowerPointWriter's Continue modifier and MaxRowsPerSlide data binding property. The MaxRowsPerSlide data binding property specifies how many rows of data will be imported into each slide. This property will be set in the Writing the Code section. For more information about Data Binding Properties see the How to Use Data Binding Properties Quick Guide. \ The Continue modifier offers a powerful way of determining how data is imported into a presentation. When importing data into a presentation, PowerPointWriter will stop importing onto a slide when the MaxRowsPerSlide limit is reached. However, if the same data marker appears in the presentation with the Continue modifier, the data will continue being imported to this data marker. If the same data marker appears in the presentation without the Continue modifier, the data will be imported from the beginning of the data source. For more information see Fitting Data on to Multiple Slides.
# Create a new content slide. This time the title of the slide should be 'Company History (cont.)'.
# Add a text box for the company logo in the bottom right. The data marker in this text box should be %%=Company.Logo(image(2))
Add a new list to the body of the slide.
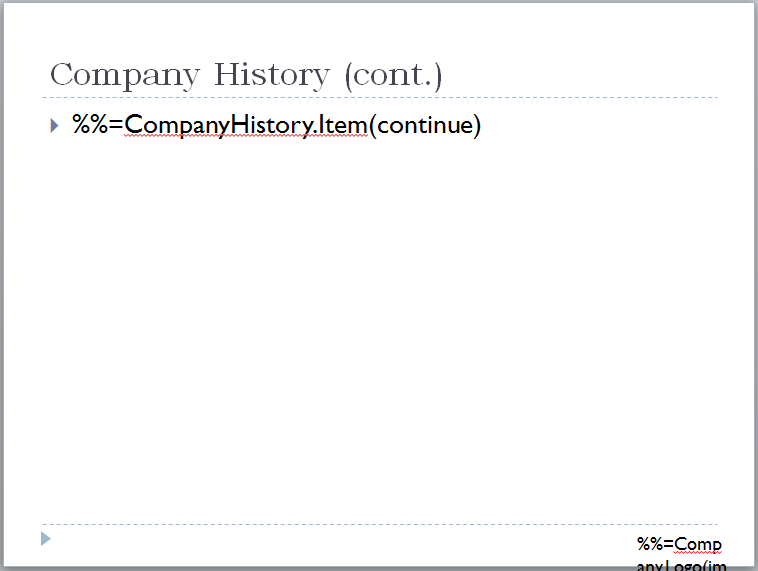
The first item in this list will be our data marker with the continue modifier: %%=CompanyHistory.Item(continue) !Slide5Final.png! Image Added \ Now our entire company history will fit neatly in our presentation. Next we will show how the Continue modifier can be used to arrange data on a single slide. Rather than having our data continue onto a new slide, we will populate a second list.
Create a new content slide with the title 'Products'. Don't forget to add the company logo to the bottom right of the slide.
In the body of this slide create two text boxes side-by-side.
In the left text box add a list.
The first item in this list will contain two data markers. Because PowerPointWriter handles data markers embedded in text, we can easily display multiple columns of data together in our presentation.
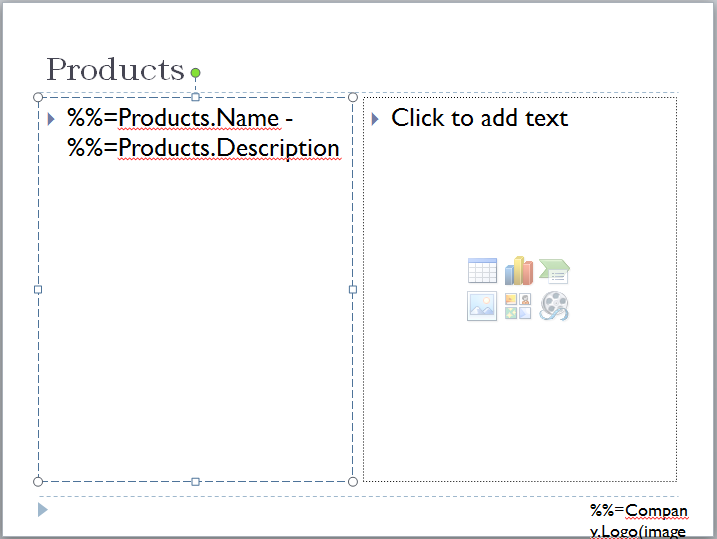
Add '%%=Products.Name - %%=Products.Description' as the first item in our list. Our slide thus far should look like the following:
#
Next, add a list to the right text box.
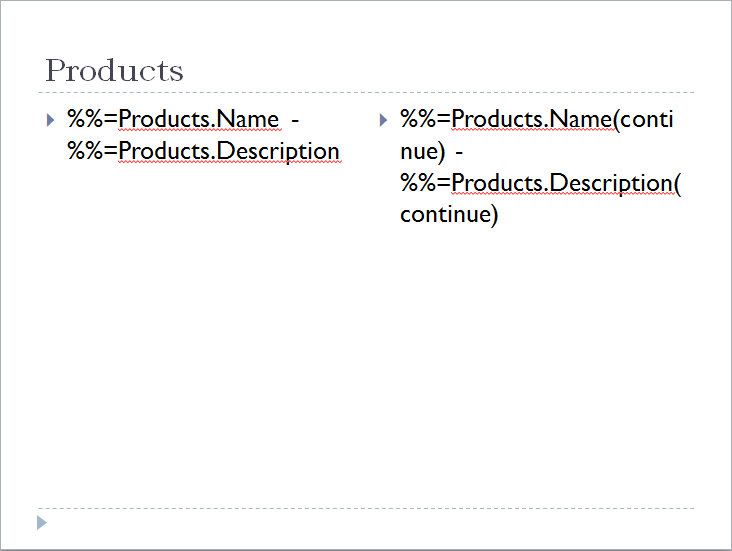
Insert '%%=Products.Name(continue) - %%=Products.Description(continue)' as the first item in the new list. Our completed slide is shown below: !Slide6Final.png! Image Added