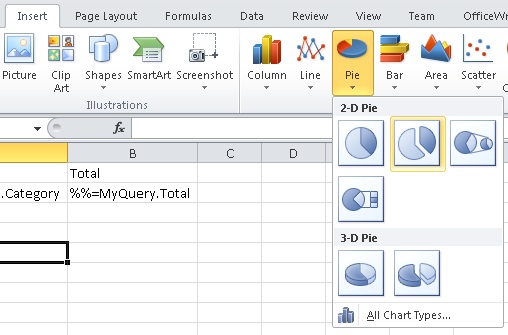
Go to the Charts section on the Insert tab in the Excel ribbon #
From the Pie chart drop-down, select the Exploded 3D pie chart. !insert_pie_chart.jpg! # Image Added
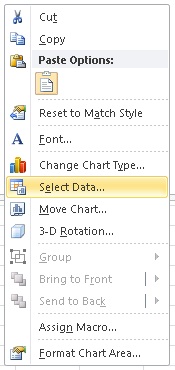
Right click on the chart and select Select Data !select_data.jpg! # Image Added
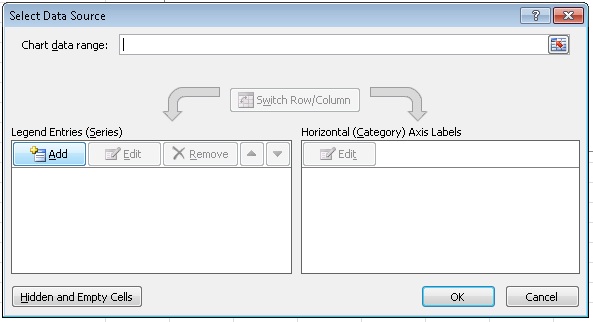
Under Legend Entries (Series) click Add to add a new series to the chart. !add_series.jpg! # Image Added
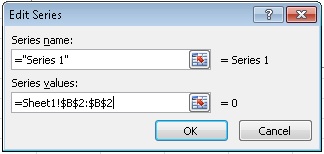
In the Edit Series dialog, set the series values to point to the cell B2, but make sure that the cell is referenced as a range (see image below). Click OK when finished. !set_data_source.jpg! # Image Added
In the Axis Labels dialog, set the label range to point to the cell A2, but also reference it at as a range. Click OK when finished. !edit_category_data.jpg! # Image Added
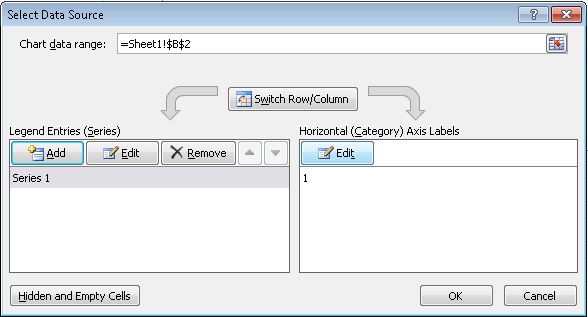
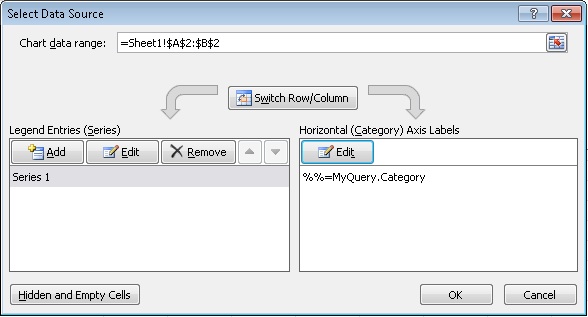
When you are done, your Select Data Source dialog should look like the image below. Click OK when you are done. !final_data_set.jpg! # Image Added
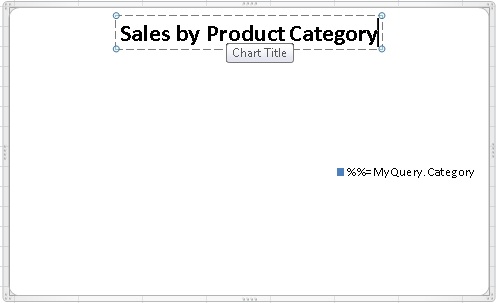
(optional) Edit the chart title !edit_chart_title.jpg|! Image Added
You have finished adding a chart to your Excel template for OfficeWriter.