Name | Description |
|---|
| Contour | Contour chart. Surface chart viewed from above.{
| Web only |
|---|
| To see what this looks like, go to our online documentation: |
|---|
| To see what this looks like, go to our online documentation: |
|---|
|
}!surface2.jpg! |
| Surface3D | 3-dimensional surface chart. Shows trends in values across two dimensions in a continuous curve.{
| Web only |
|---|
| To see what this looks like, go to our online documentation: |
|---|
| To see what this looks like, go to our online documentation: |
|---|
| }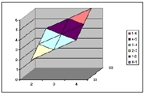 Image Removed Image Removed | |
!surface0.jpg! |
| Wireframe3D | 3-dimensional surface chart without color.{
| Web only |
|---|
| To see what this looks like, go to our online documentation: |
|---|
| To see what this looks like, go to our online documentation: |
|---|
|
}!surface1.jpg! |
| Anchor |
|---|
| WireframeContour |
|---|
| WireframeContour |
|---|
|
WireframeContour | Contour chart without color.{
| Web only |
|---|
| To see what this looks like, go to our online documentation: |
|---|
| To see what this looks like, go to our online documentation: |
|---|
| }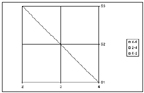 Image Removed Image Removed | |
!surface3.jpg! |
