
.
Table of Contents | ||||
|---|---|---|---|---|
|
| Note |
|---|
This is Part 2 of the three-part tutorial series Financial Report scenario. It is recommended that you complete Part 1 - Sub-Report with ModifiersUsing Modifiers and Ordinal Syntax before starting this section. This tutorial also assumes a basic understanding of how ExcelTemplate imports data how that affects formulas and formatting. |
| Info | ||
|---|---|---|
| ||
In the downloadable ExcelWriter_Basic_Tutorials.zip, there is a completed template file located in CompleteFinancialReport/templates/Part2_Financial_Template.xlsx. |
In this tutorial ExcelTemplate is being used to populate data in a template set up with styles and formats. This part of the tutorial uses formulas and persists Excel styles.
| Warning |
|---|
There is a unnecessary amount of coverage for setting up formulas. This was already covered in the Simple Expense Summary. The customer should be able to have a template that already has the data (starting template). They should just need to add number formats, conditional formatting, and styles. |
This sub-report makes use of a data sheet. This is where the data markers will go. It should look something like this: 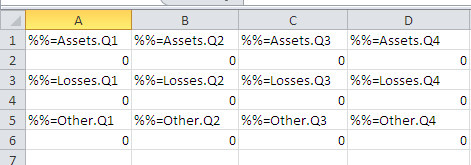
The alternating rows (highlighting added for demonstration) contain the SUM Excel formula. The formula is visible in the function bar below: 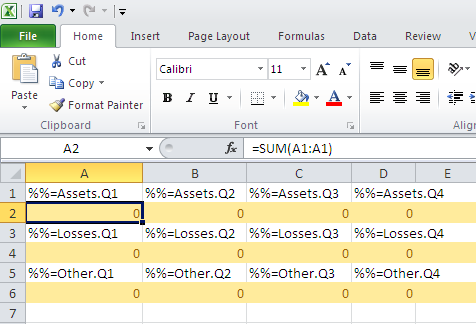
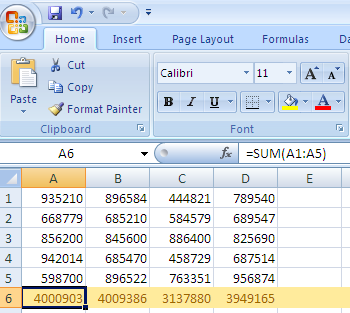
The sum formula is a standard Excel function, which gets updated when ExcelWriter populates the file with data. When the data is populated, the A1:A1 reference gets updated to include all the rows of data. The result should be something like this (highlighting added for demonstration):
The next step is adding references to the data sheet. This example references the "SUM" formulas on the data sheet. These sums are added to a percent change equation. This will result in a template resembling the following: 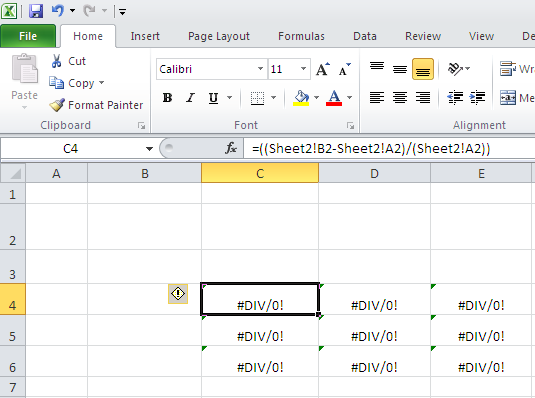
Note the formula in the formula bar, "Sheet2" is the data sheet.
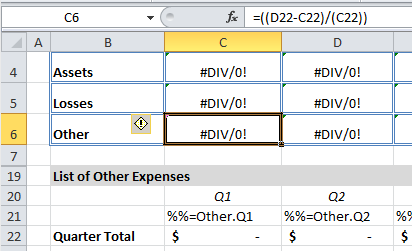
Also, the error message is because there currently isn't any data, so Excel is throwing a 'Divide by 0' error. This will not be in the output file because the file will contain data.
| Info | ||
|---|---|---|
| ||
In this example, the sum rows alternate on the data sheet. If you stretch a formula, you'll have to update the references to skip every other row. |
1. Select C4 on Sheet1.
2. Start to type the formula by entering =(
3. Click over to Sheet2, Row 2 and select the second SUM cell. (B2 in this example)
4. Go back to Sheet1 and add a minus sign for =(Sheet2!B2-
5. Click over to Sheet2, Row 2 again and select the first SUM cell.
6. Continue selecting cells into formulas to end up with this: The goal of this part of the tutorial is how to apply number formats and conditional formatting to ExcelTemplate files and what you can expect as ExcelTemplate imports data.
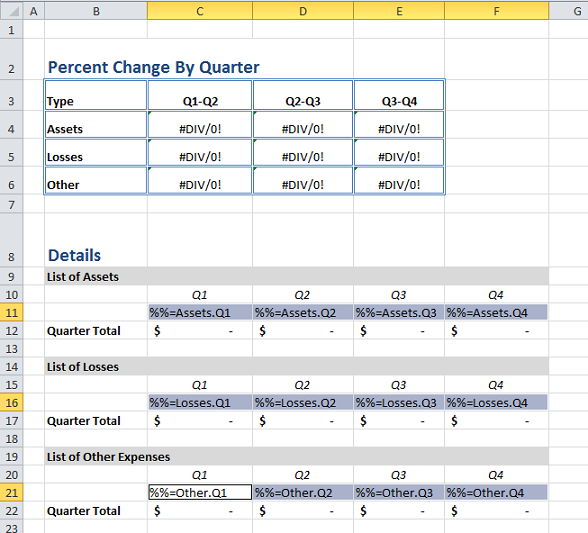
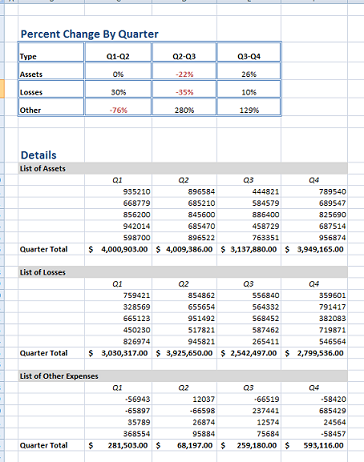
The final template will look like this:
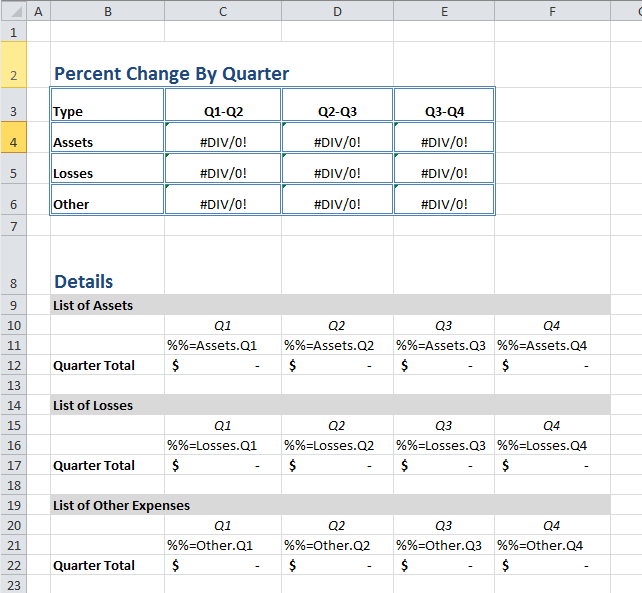
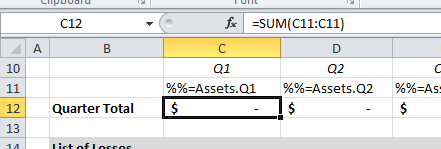
The bottom of the worksheet has a section for the data that will be imported. Each section has a total row summing all of the values for the section. This formula will expand as ExcelTemplate imports data.
At the top is a grid that calculates the percent in change between each quarter, based on the asset, loss, and other totals. The formulas are set up as "=(Sheet2!B2-Sheet2!A2)/(Sheet2!A2)
7. Drag this formula Horizontally only because of the alternating rows.
8. Repeat with rows 4 and 6
The value returned by the percent change equation should be displayed as a percentage. The table cells all have to be formatted.
1. Select all cells" for each cell in the grid.
This section will cover how to add number formatting and the expected behavior for ExcelTemplate as it imports data.
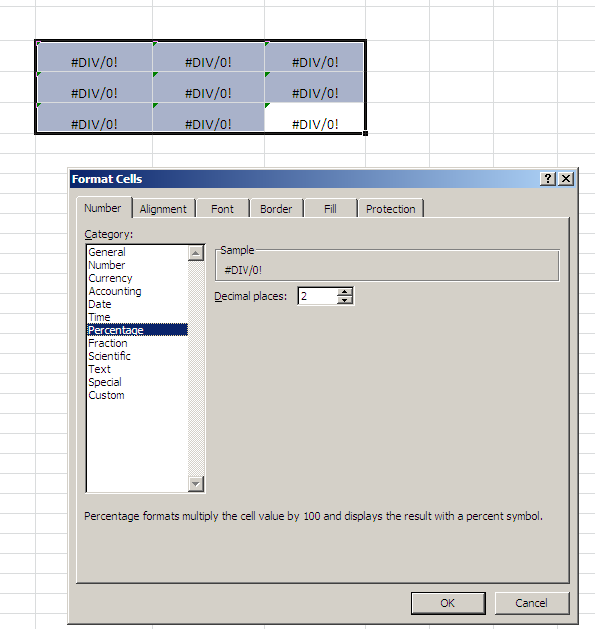
1. Select the 9 cells in the percentage grid at the top of the worksheet (C4:E6).
2. Right click and select "Format Cells..."
3. Select "Percentage" on the Number tab.
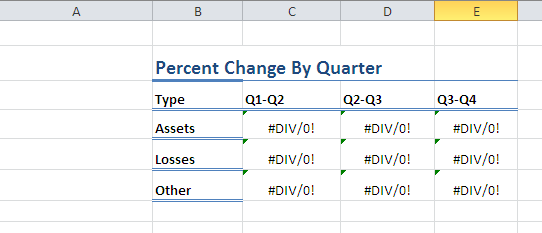
The next step is setting up the table. Add a header and label the rows and columns to end up with a complete table: 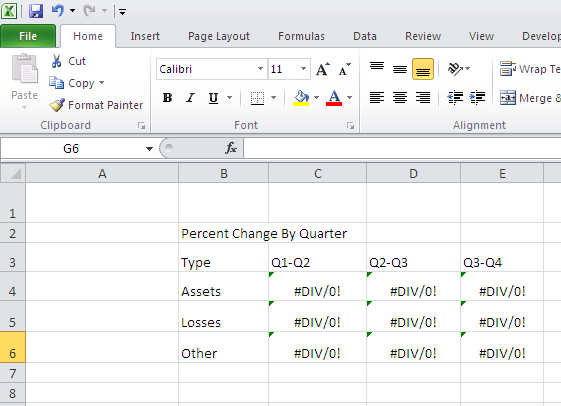
Once the table is complete, add styles.
1.Select "Percent Change by Quarter" and set it to "Heading 1." Heading 1 is found in the named styles list, on the "Home" tab of the ribbon.
2. Select the header row (B3:E3) and set it to "Total" in the named styles menu.
3. Select the row labels (B4:B6) and set that to "Total."
You should now have this:
4. Select the area of B3:E6, and apply a consistent border:
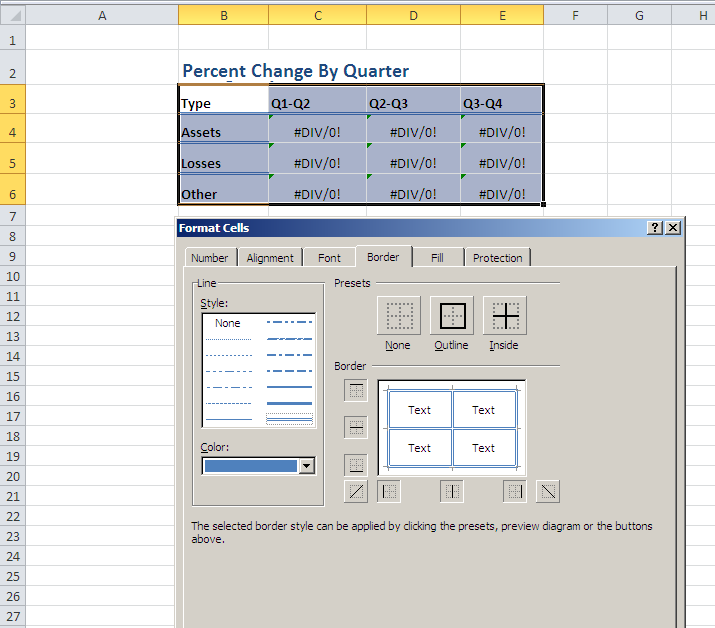
5. Now select B2:E2 and apply a bottom border in dark blue.
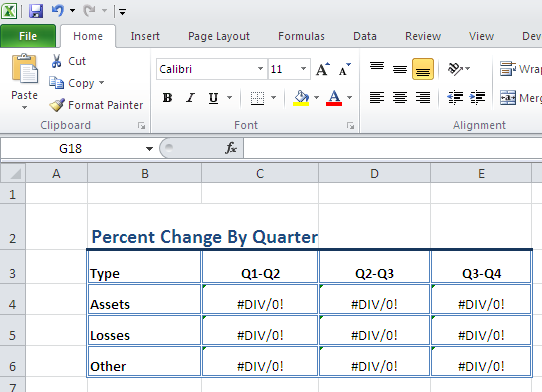
The final template should look like this:
4. Click OK
5. Select cells C12:F12, C17:F17, and C22:D22.
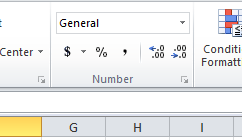
6. In the top tool bar, under the 'Number' tab, click the "$" to apply the currency format.
So far the number formats have been applied to cells that only contain formulas, but number formats also work with cells that contain data markers.
1. Select cells C11:F11, C16:F16, C21:F21.
2. At the top bar, click the "$" to apply the currency format.
As ExcelTemplate populates the worksheet, the number format will be copied to all the new rows of data that are inserted where the data markers are.
ExcelTemplate will preserve existing conditional formatting. If the conditional format includes a formula, that formula will also be updated as new rows are inserted into the file.
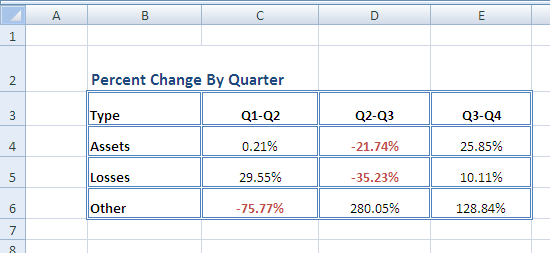
In this case, the conditional formatting will be applied to the 'percent table' and it format negative numbers to be bold and red.
1. On the "Home" tab in Excel, click on "Conditional Formatting"
2. Select "New Rule..."
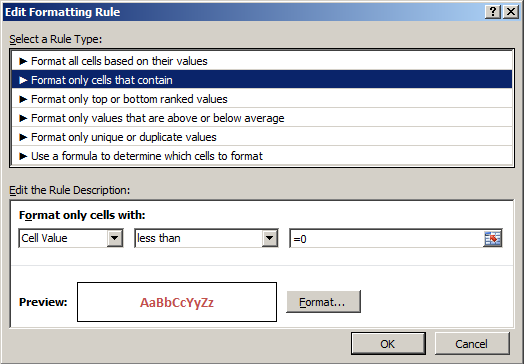
3. In this tutorial the condition type is "Format only cells that contain..." The rule is "Cell value less than 0"
4. Click on "Format..." Set the text to be dark red. Set the typeface to be bold.
5. Click OK to save the rule.
| Info | ||
|---|---|---|
| ||
In the sample code, the reference to SoftArtisans.OfficeWriter.ExcelWriter.dll has already been added to the CompleteFinancialReport project. |
...
1. Include the SoftArtisans.OfficeWriter.ExcelWriter namespace in the code behind
| Code Block |
|---|
using SoftArtisans.OfficeWriter.ExcelWriter;
|
...
3. Open the template file with the ExcelTemplate.Open method.
| Code Block |
|---|
XLT.Open(Page.MapPath("//templates//Part2_Financial_Template.xlsx"));
|
4. Create a DataBindingProperties object. None of the binding properties will be changed for this tutorial, but DataBindingProperties is a required parameter in ExcelTemplate data binding methods.
| Code Block |
|---|
DataBindingProperties dataProps = XLT.CreateDataBindingProperties();
|
1.Get the data for the Assets, Losses, and Other datasets
| Info | ||
|---|---|---|
| ||
In the sample projectSimilarly to part 1, we are parsing CSV files with query results, rather than querying a live database. The CSV files are available under the data directory. There is a copy of the CSV parser, |
1.Get the data for the Assets, Losses, and Other datasets
These calls are to a helper method GetCSVData that parses the CSV files and returns a DataTable with the values.
If you are following in your own project and would like to parse the CSV files as well, you will need to:
...
| Code Block |
|---|
...
...
| Code Block |
|---|
DataTable dtAssets = GetCSVData("//data//Assets.csv");
DataTable dtLosses = GetCSVData("//data//Losses.csv");
DataTable dtOther = GetCSVData("//data//Other.csv");
|
2. Use ExcelTemplate.BindData to bind the data for the Assets, Losses, and Other data sets.
| Code Block |
|---|
XLT.BindData(dtAssets, "Assets", bindingProps);
XLT.BindData(dtLosses, "Losses", bindingProps);
XLT.BindData(dtOther, "Other", bindingProps);
|
3. Call ExcelTemplate.Process() to import all data into the file.
| Code Block |
|---|
XLT.Process();
|
4. Call ExcelTemplate.Save() to save the final file.
| Code Block |
|---|
XLT.Save(Page.Response, "temp.xlsx", false);
|
The final output should look something like this:
| Code Block |
|---|
using SoftArtisans.OfficeWriter.ExcelWriter;
...


//Instantiate the template object
ExcelTemplate XLT = new ExcelTemplate();
//Open the file
XLT.Open(Page.MapPath("//templates//Part1_Financial_Template.xlsx"));


//Create data binding properties
DataBindingProperties bindingProps = XLT.CreateDataBindingProperties();


//Get the data from the CSVs. More info about the generic parser is available
//in the project and in the tutorial above.
DataTable dtAssets = GetCSVData("//data//Assets.csv");
DataTable dtLosses = GetCSVData("//data//Losses.csv");
DataTable dtOther = GetCSVData("//data//Other.csv");

//Bind each datatable
XLT.BindData(dtAssets, "Assets", bindingProps);
XLT.BindData(dtLosses, "Losses", bindingProps);
XLT.BindData(dtOther, "Other", bindingProps);

//Call process to import data to file
XLT.Process();

//Call save
XLT.Save(Page.Response, "temp.xlsx", false);
|
TBA
You can download the code for the Financial Report here.