
.
...
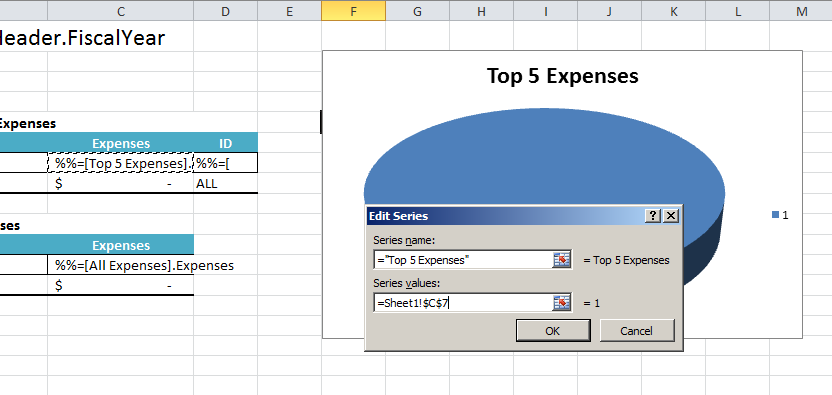
This will put the formula =Sheet1!$C$7 as the formula for the series values. When ExcelWriter inserts data, this formula will expand to include the new rows, so all the top 5 expenses data will be included in the chart series.
8. In the Select Data Source dialog, select the Horizontal (Category) Axis Label that was automatically added and click Edit.
...
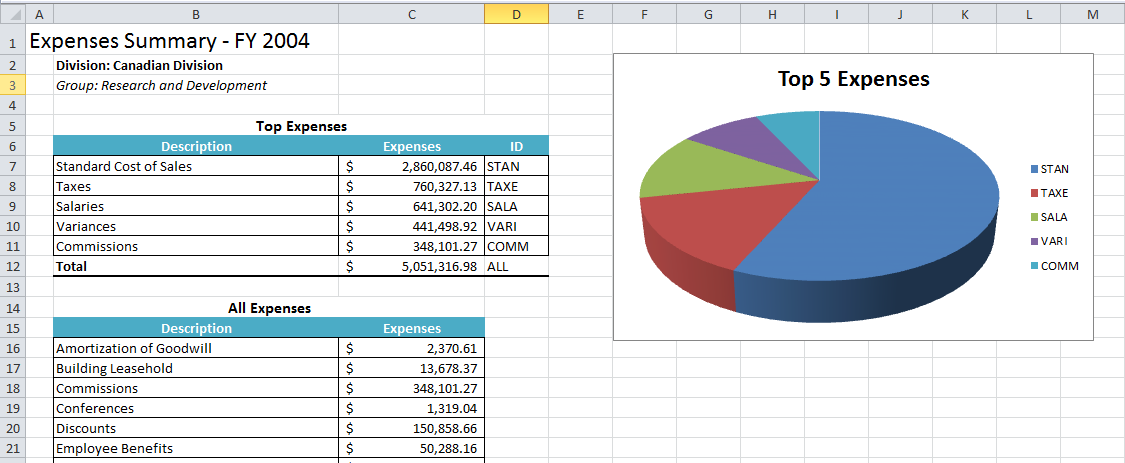
You will see that the pie chart is pulling the data from C7:C11 and the labels from D7:Dll.
| Csharp | ||||
|---|---|---|---|---|
| ||||
using SoftArtisans.OfficeWriter.ExcelWriter;
...
ExcelTemplate XLT = new ExcelTemplate();

XLT.Open(Page.MapPath("//templates//part1_template.xlsx"));

DataBindingProperties dataProps = XLT.CreateDataBindingProperties();

object[] valuesArray = { "FY 2004", "Canadian Division", "Research and Development" };
string[] columnNamesArray = { "FiscalYear", "Division", "Group" };

XLT.BindRowData(valuesArray, columnNamesArray, "Header", dataProps);

DataTable dtTop5 = GetCSVData(Page.MapPath("//data//Part1_Top5Expenses.csv"));
DataTable dtAll = GetCSVData(Page.MapPath("//data//Part1_AllExpenses.csv"));

XLT.BindData(dtTop5, "Top 5 Expenses", dataProps);
XLT.BindData(dtAll, "All Expenses", dataProps);

XLT.Process();

XLT.Save(Page.Response, "Part1_Output.xlsx", false);
|
...