
.
Table of Contents | |
|---|---|
|
...
...
| Excerpt |
|---|
A PivotTable |
...
is an interactive table which allows the user to transpose, filter, sort, and aggregate large amounts of data into a single table format. ExcelWriter works with PivotTables in two ways: include a PivotTable in |
...
...
template file or manipulate PivotTables programmatically |
...
with |
| Note |
|---|
The ability to programmatically manipulate PivotTables was introduced in OfficeWriter 8.4.0. |
A PivotTable uses a two-dimensional area of cells for a data source. The first row in the data source must contain names for each column of data and the data source must contain at least one row of data. The data can include regular values or formulas, but it must be a continuous area of cells.
...
Row labels and Column Labels group the same values together to nest data and display subtotals for different groups. You can use row and column labels to transpose data.
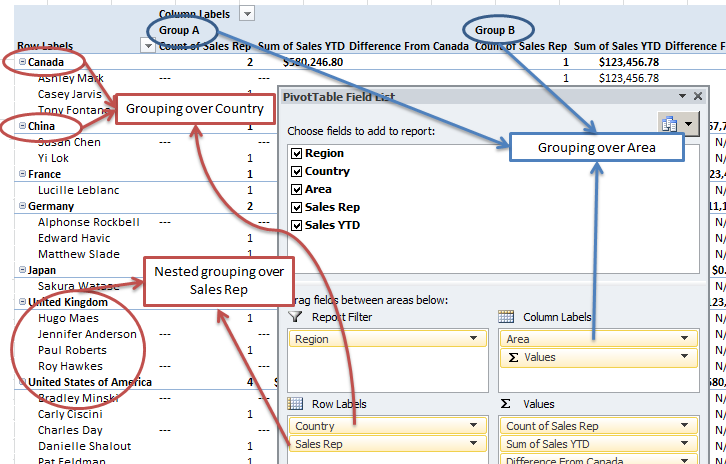
You will note that there is a values label listed under the column labels. This is a row or column label that is automatically generated whenever there are two or more data fields. These represent the labels for the data fields in the table. This label can be either a row label or a column label and cannot be modified.
...
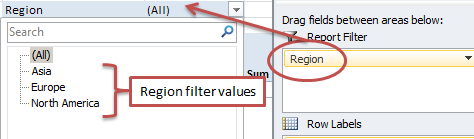
Report Filters, or page fields,
provide filtering across the entire PivotTable.
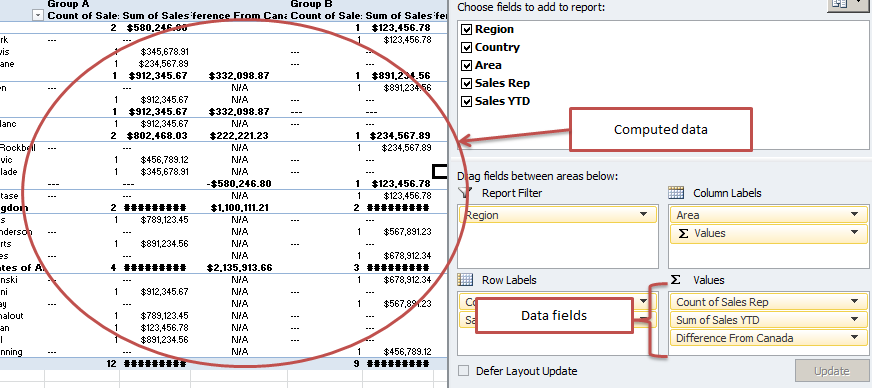
Data fields, or value fields, are used to summarize and aggregate data values with formulas. The values computed from the data fields make up the majority of the PivotTable.
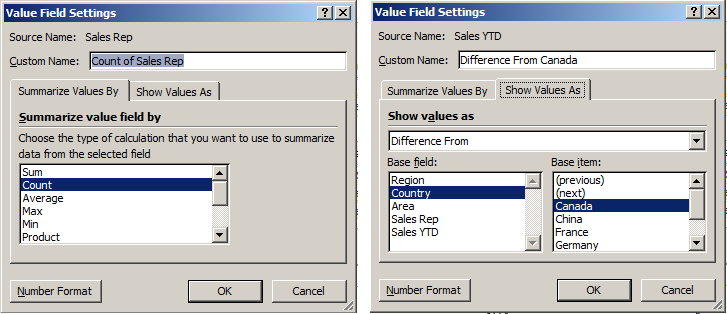
Data fields have different settings for how to aggregate and compute the data. The first of these is Summarize Values By, which determines the function used to aggregate the data, for example, Sum, Count, Average, Min, Max etc. The second is Show Values As, which allows you to change how the aggregation is display. For example, you can specify that you want to do a sum, but show the values as a percentage of the column total.
Those are the basics of PivotTables. To learn how to use PivotTables with ExcelTemplate, see Templates and PivotTables. To learn how to create or manipulate PivotTables with ExcelTemplate, see Creating a Basic PivotTable or our PivotTable API reference.