
.
Table of Contents |
|---|
A PivotTable is an interactive table which allows the user to transpose, filter, sort, and aggregate large amounts of data into a single table format. ExcelWriter works with PivotTables in two ways: include a PivotTable in an ExcelTemplate template file or manipulate PivotTables programmatically with ExcelApplication. This article provides a brief overview on the functionality of PivotTables.
A PivotTable uses a two-dimensional area of cells for a data source. The first row in the data source must contain names for each column of data and the data source must contain at least one row of data. The data can include regular values or formulas, but it must be a continuous area of cells.
Here is an example of a data source for a PivotTable:
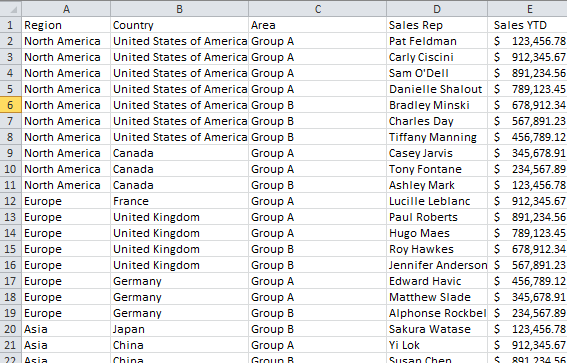
When a PivotTable is created using the data source, a copy of this data is stored in the pivot cache or PivotTable cache. Multiple PivotTables can use data from the same pivot cache.
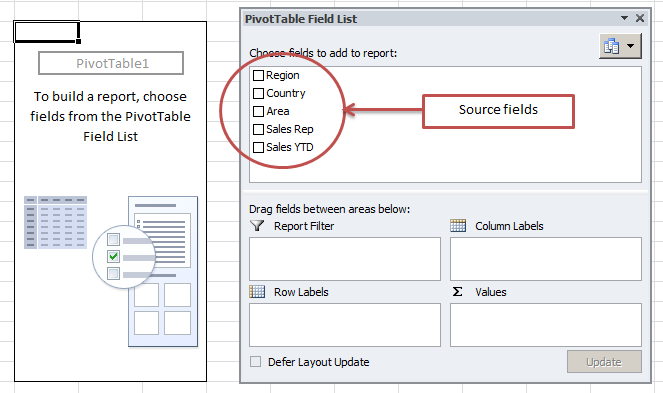
After a PivotTable has been created, it is given a default area that is 3 columns wide and 18 rows tall until the source fields are used to create additional PivotTable fields.
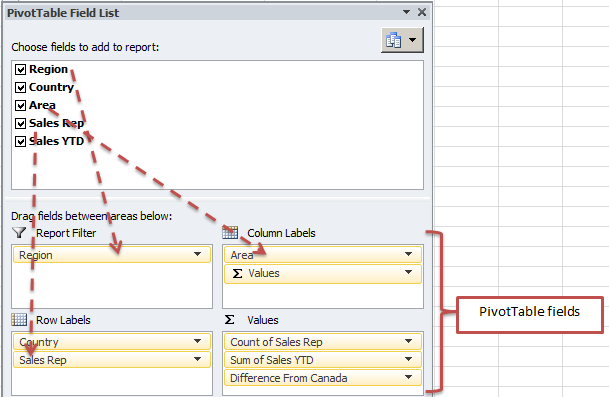
A list of source fields is automatically generated based on the column names from the data source. These fields are used for building other types of PivotTable fields, such as report filters, column labels, row labels, or data fields.
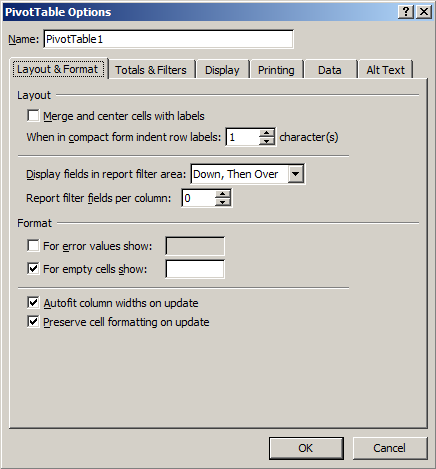
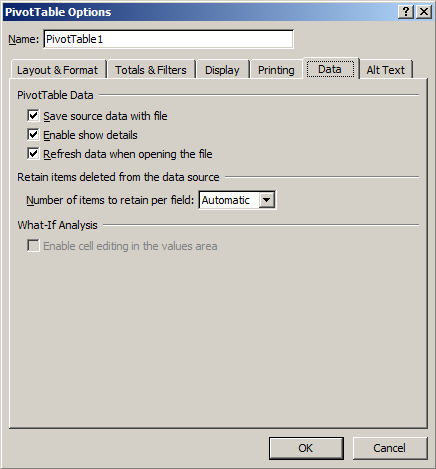
There are numerous settings that can be applied to a PivotTable. These are available by right-clicking on the PivotTable and going to PivotTable Options in Excel. The settings are organized into groups, based on how they affect the PivotTable.
A PivotTable is made up of different PivotTable fields, which can perform different actions on data. PivotTable fields are created from source fields. In Excel this is done by dragging a source field into one of the pivot field areas.
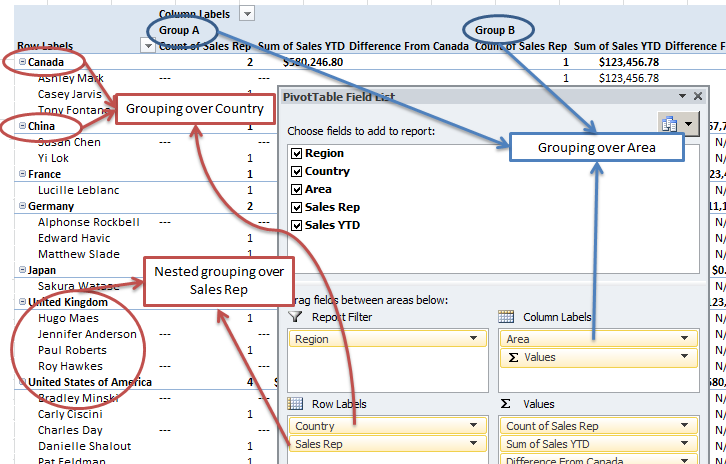
Row labels and Column Labels group the same values together to nest data and display subtotals for different groups.
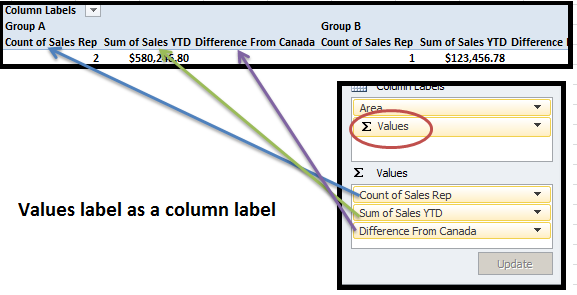
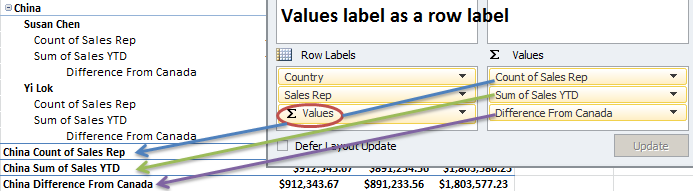
You will note that there is a values label listed under the column labels. This is a row or column label that is automatically generated whenever there are two or more data fields. These represent the labels for the data fields in the table. This label can be either a row label or a column label and cannot be modified.
Report Filters, or page fields,
