You are viewing an old version of this page. View the current version.
Compare with Current
View Page History
« Previous
Version 2
Next »
Description
Enumerations for area chart types
Values
Name |
Description |
Area3D |
Area chart with 3-dimensional visual effect.{web-only:To see what this looks like, go to our online documentation:}!area3.jpg!
Stacked |
Stacked area chart. Displays the trend of the contribution of each value over time or categories.{web-only:To see what this looks like, go to our online documentation:}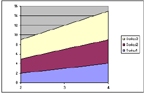 |
|
Stacked100Percent |
100% stacked area chart. Displays the trend of the percentage each value contributes over time or categories.{web-only:To see what this looks like, go to our online documentation:}!area2.jpg!
Stacked3D |
Stacked area chart with 3-dimensional visual effect.{web-only:To see what this looks like, go to our online documentation:}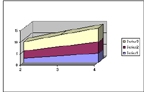 |
|
Stacked3D100Percent |
100% stacked area chart with 3-dimensional visual effect.{web-only:To see what this looks like, go to our online documentation:}!area5.jpg!
StandardArea |
Standard area chart. Displays the trend of values over time or categories.{web-only:To see what this looks like, go to our online documentation:}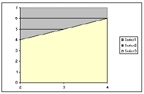 |
|

